
Map

In 1920, the foreign-born and the children of immigrants were almost half of West Philadelphia’s population. 

The population was heavily concentrated at the east end of West Philadelphia, near the bridges to Center City. At the west end, many large estates and farms were to be found. Whites were overwhelmingly the dominant racial group, concentrated in West Philadelphia’s streetcar suburbs. Much of the area shown at the center of the map below Market St. was, as the urban historian Kenneth Jackson puts it, a “crabgrass frontier,” whose development awaited the coming of the Market St. Elevated.

At the end of the 19th century, the population of West Philadelphia was just over 100,000.

Aerial View of Martha Washington

This Google map looking north shows the proximity of the Martha Washington Elementary School playground to the site of the “Lex Street Massacre” above Aspen St. The city and school district tolerated the presence of a crack house within yards of a public school—a situation that was only rectified after a mass shooting took place in the house. 

1927 Bromley map of Martha Washington Public School

Martha Washington School, shown on the Bromley map of West Philadelphia in 1927, on the block of Fairmount, Aspen, and Lex Street.


The School District of Philadelphia’s extension of the Martha Washington playground in the 1960s removed Lex St. between 44th & 45th above Fairmount and gave the school the entire block from Fairmount to Aspen between 44th and 45th streets.


Martha Washington Elementary School was racially segregated during the second half of the twentieth century—and it remains so today. The entrance to the school’s playground on Aspen Street stood just yards from the doorstep of 816 N. Lex St., where the city’s worst mass shooting occurred on 28 December 2000. 

Map showing density of Black population in West Philadelphia, 1950

This digital map drawn from the 1950 U.S. Census shows the growing presence of blacks west of the Schuylkill River in 1950. The black presence in the Mill Creek neighborhood appears in the 60–80 percent range at mid-century.

Household Ethnicities, Mill Creek, 1940

This digital map drawn from the 1940 U.S. Census shows the racial/ethnic configuration of the Mill Creek neighborhood before World War II. In 1940, the African-American population of West Philadelphia was concentrated within a few blocks north of Market St. Mill Creek was located at the center of that area.  About 70 percent of the adult African Americans were born in southern states and moved north as part of the Great Migration.


Just under half of Mill Creek was white. Twenty-one percent of the adults were foreign-born. The majority was born in Ireland.  Many of the Irish-born were Catholics, living near Cathedral Park Cemetery.


As shown here, the neighborhood is properly described as racially/ethnically “mixed.” Yet while blacks and whites lived relatively close to one another, Brown Street (visible though unnamed on this map) divided the predominately white—i.e., native-white and Irish-born—blocks above that street from the predominately black blocks below it.  

PHA Mill Creek Haddington Map, 1960

This map published by the Philadelphia Housing Association in 1960 shows the geographical relationship of three areas that were studied by the Housing Association, a private watchdog organization led by Philadelphia activists for housing improvement. Haddington Leadership Area contained Haddington Homes.

Nonwhite Housing Occupancy in Haddington, 1950

This 1950 digital census map shows nonwhite housing occupancy in Haddington’s core blocks between 52nd and 60th streets. 

J.M. Brewer’s Insurance Map of Philadelphia, 1934

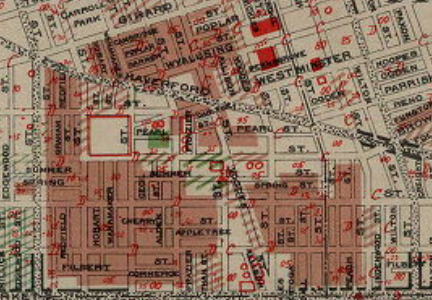
J.M. Brewer’s Map of Philadelphia, 1934.

Brewer was the Metropolitan Life Insurance Company’s chief appraiser for the Philadelphia district. His detailed block-level map, printed in two sections, North and South, was used by the federal Home Owners’ Loan Corporation (HOLC), whose redlining maps were to govern the nation’s home-lending policies and practices for the next three decades.


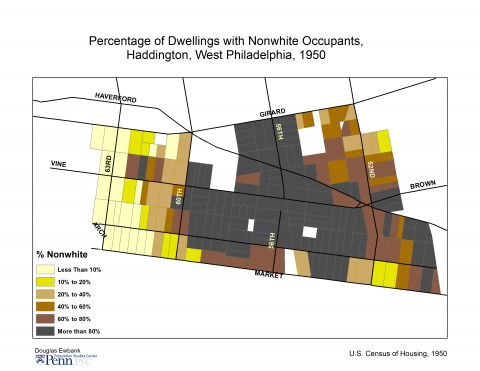
Brewer’s color-coded map shows Haddington’s population as African American (brown), excepting a small concentration of Italians (green).  In the redlining scheme, the neighborhood had a D rating, which would disqualify it for federally insured mortgages or housing conservation.
Italians dominated the blocks west of 63rd St. below Haverford Avenue.

Pages